Building a clear financial picture for your business can feel complicated, especially when revenue, costs, and operational expenses constantly change. A structured financial model helps you plan ahead, evaluate performance, and make smarter decisions. This free Excel Annual Business Financial Model Template gives you a simple but powerful framework to forecast and track your company’s finances across an entire year.
This Excel template includes three connected sheets designed for planning and analysis: a Profit & Loss view, a cash flow perspective, and an assumptions sheet where you control the core inputs. All calculations are automatically linked with formulas, so when you update numbers in one place, the entire model adjusts instantly.
The template is built for Microsoft Excel and also works smoothly in Google Sheets, making it flexible for teams using different tools. Whether you’re running a startup, managing a small business, or preparing financial projections for investors, this model helps you stay organized and focused.
What This Excel Financial Model Template Includes
This Excel template is designed around a straightforward monthly structure so you can view your financial performance across the entire year. Each month contains the following key financial metrics:
- Month – The reporting period for each financial entry.
- Revenue – Total sales or income generated during the month.
- COGS (Cost of Goods Sold) – Direct costs required to produce or deliver your product or service.
- Gross Profit – Automatically calculated as Revenue minus COGS.
- Operating Expenses (OpEx) – Day‑to‑day costs like salaries, marketing, rent, and subscriptions.
- EBITDA – Earnings before interest, taxes, depreciation, and amortization.
- Net Income – Your final monthly profit after all expenses.
Because the formulas are already built into the Excel template, you only need to input a few numbers to generate meaningful financial projections.
Why Use an Annual Financial Model
Many small businesses rely on simple spreadsheets or accounting software for tracking expenses, but those tools do not always help with forward-looking planning. An annual financial model allows you to forecast performance, identify potential problems early, and set realistic growth targets.
Here are several reasons businesses rely on financial modeling:
- Budget planning for the upcoming year
- Cash flow forecasting to prevent shortages
- Investor presentations and funding discussions
- Strategic decision making about hiring, expansion, or marketing
- Scenario analysis to test best‑case and worst‑case outcomes
This Excel template keeps everything simple and transparent so you can quickly understand how revenue and costs affect profitability.
Structure of the Template
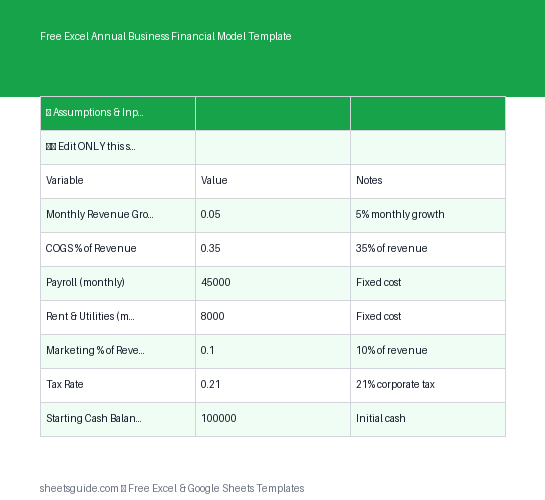
1. Assumptions Sheet
The assumptions sheet is where you define the key variables that drive your financial model. Instead of entering data repeatedly across multiple worksheets, you update core numbers in one place.
Common assumptions include:
- Expected monthly revenue
- Cost of goods percentages
- Marketing spending
- Payroll costs
- Operational overhead
Because every formula references this sheet, changing a value instantly updates your projections across the entire workbook.
2. Profit & Loss Overview
The Profit & Loss sheet provides a clear breakdown of monthly financial performance. This view helps you quickly identify whether your business is profitable and which costs have the biggest impact.
Using the columns provided in the template, Excel automatically calculates:
- Gross profit from revenue and COGS
- Operating income after expenses
- EBITDA for performance analysis
- Net income for final profitability
This structure mirrors the type of financial reporting used by many startups and growing companies.
3. Cash Flow Tracking
Profit does not always equal cash in the bank. The cash flow sheet helps you understand how money actually moves through your business each month.
By linking revenue and expenses from the P&L model, this sheet gives you a simplified view of cash entering and leaving your company.
Monitoring cash flow helps prevent one of the most common problems in business: running out of cash even when sales appear strong.
Who This Excel Template Is For
This financial model is designed to be flexible enough for many different types of users. You do not need advanced financial modeling experience to start using it.
Common users include:
- Startup founders preparing financial projections
- Small business owners planning annual budgets
- Freelancers managing business income and expenses
- Consultants building financial plans for clients
- Students learning financial modeling basics
Because the structure is simple and transparent, it is easy to customize the Excel template to match different industries.
How to Use in Excel
Getting started with this Excel template only takes a few minutes. The formulas are already built, so your main task is entering realistic assumptions and monthly projections.
Step 1: Download and Open the Excel Template
Open the Excel file in Microsoft Excel. If you prefer working online or collaborating with a team, the template can also be uploaded and used in Google Sheets.
Step 2: Enter Your Business Assumptions
Start with the assumptions sheet. Input your expected revenue, cost percentages, and monthly expenses. These numbers will drive the rest of the model.
For example, you might enter:
- Projected monthly sales
- Average cost of goods sold percentage
- Monthly marketing budget
- Employee salaries
- Software or operational subscriptions
Step 3: Review the Monthly Financial Model
Once assumptions are entered, move to the main financial model sheet. You will see each month of the year listed with the following columns:
- Month
- Revenue
- COGS
- Gross Profit
- OpEx
- EBITDA
- Net Income
The Excel formulas automatically calculate profit metrics based on the values you entered.
Step 4: Analyze Profitability
Look at the EBITDA and Net Income columns to evaluate overall performance. If profits appear too low, you can experiment with different assumptions such as increasing revenue or reducing operational expenses.
Step 5: Update Monthly Performance
As the year progresses, replace projected numbers with real financial data. This allows the Excel template to transition from a forecast model into a real performance tracker.
Tips for Building Better Financial Forecasts
Even the best Excel template depends on realistic assumptions. Here are a few tips to make your financial projections more useful:
- Be conservative with revenue projections. Overestimating sales is a common mistake.
- Include all recurring expenses. Small subscriptions and services can add up.
- Plan for seasonal changes. Some months may generate higher or lower sales.
- Review the model monthly. Update projections based on actual results.
- Create multiple scenarios. Test optimistic, realistic, and conservative forecasts.
Using scenario analysis inside the Excel template helps you prepare for uncertainty while maintaining a clear financial strategy.
Customize the Template for Your Business
One of the biggest advantages of using an Excel template is flexibility. You can easily modify the model to match the structure of your company.
Possible customizations include:
- Adding additional expense categories
- Breaking revenue into multiple product lines
- Including tax calculations
- Adding charts or dashboards
- Extending the model to multiple years
Because Excel formulas connect the sheets, expanding the model is straightforward once you understand the basic structure.
Final Thoughts
A strong financial model is one of the most valuable planning tools for any business. It transforms raw numbers into insights that guide smarter decisions.
This Free Excel Annual Business Financial Model Template gives you a clear structure for forecasting revenue, managing expenses, and tracking profitability across a full year. With automated formulas and a simple monthly layout, it removes much of the complexity typically associated with financial modeling.
Use the template in Excel for detailed financial planning, share it with collaborators if needed, and update it regularly as your business grows. Over time, this type of structured financial model can become a central tool for budgeting, forecasting, and strategic planning.