If you’re evaluating rental properties, running the numbers quickly and accurately is non-negotiable. This Excel template is designed to help you calculate key real estate investment metrics like ROI, cap rate, cash-on-cash return, and break-even performance without building formulas from scratch.
Built for both Excel and compatible with Google Sheets, this tool gives you a clean, structured way to compare multiple properties and make confident investment decisions.
Why Use an Excel Template for Real Estate ROI?
Real estate investing involves more than just estimating rent and hoping for appreciation. You need a reliable way to analyze income, expenses, and returns across different properties. This Excel template simplifies that process by automating calculations and keeping everything organized in one place.
Instead of juggling multiple spreadsheets or doing manual math, you can focus on evaluating deals and spotting opportunities faster.
What This Excel Template Calculates
This Excel template is structured around the core financial metrics every real estate investor should track:
- Net Income – Monthly rental income minus expenses
- Cap Rate – Measures return based on property value
- Cash-on-Cash Return (COC) – Evaluates return based on actual cash invested
- Break-even insight – Helps you understand how close a property is to covering its costs
All calculations update automatically when you enter or adjust your inputs.
Template Structure and Columns
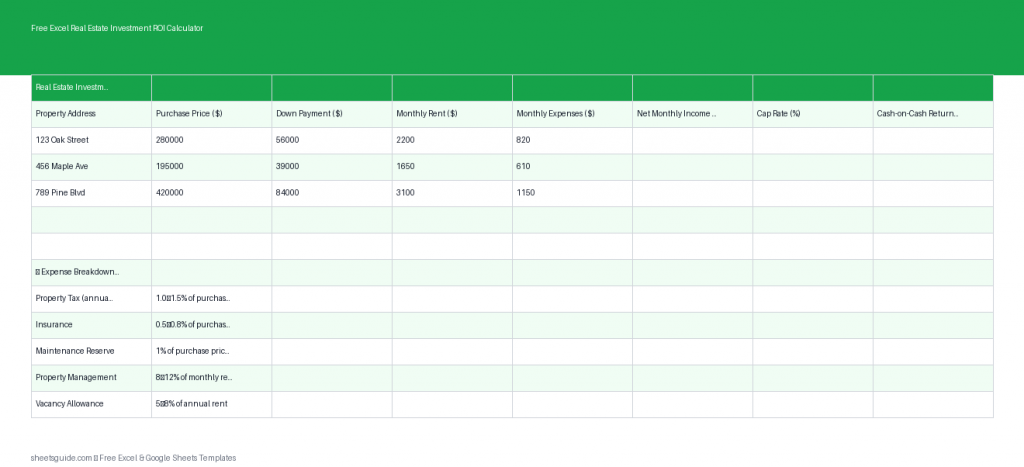
The Excel template includes the following columns to keep your analysis consistent and easy to compare:
- Property – Name or address of the property
- Purchase Price – Total acquisition cost
- Monthly Rent – Expected rental income
- Expenses – Monthly operating costs (taxes, insurance, maintenance, etc.)
- Net Income – Automatically calculated
- Cap Rate – Automatically calculated
- COC Return – Automatically calculated
This structure allows you to compare multiple properties side-by-side and quickly identify which ones meet your investment criteria.
How to Use in Excel
- Download and open the Excel template in Microsoft Excel.
- Enter each property in a new row under the Property column.
- Input the purchase price for each property.
- Add estimated monthly rent based on market research.
- Enter total monthly expenses, including taxes, insurance, maintenance, property management, and vacancy allowance.
- Review automatic calculations for Net Income, Cap Rate, and Cash-on-Cash Return.
- Compare results across properties to identify the strongest investment opportunities.
- Adjust assumptions (rent, expenses, or price) to test different scenarios.
The template is fully editable, so you can customize it to include additional fields like financing details, vacancy rates, or renovation costs if needed.
Understanding the Key Metrics
Net Income
Net income is the foundation of your analysis. It represents the cash left after covering operating expenses. A property with strong rental income but high expenses may not perform as well as expected, so this number helps you see the real picture.
Cap Rate
Cap rate is one of the most widely used metrics in real estate investing. It shows the return on a property based on its purchase price, without considering financing.
Higher cap rates typically indicate better returns, but they may also come with higher risk depending on the market or property condition.
Cash-on-Cash Return
Cash-on-cash return focuses on the return relative to the cash you’ve actually invested. This is especially important if you’re using financing, since it reflects how efficiently your capital is working.
This metric is particularly useful when comparing leveraged investments or deciding between multiple deals with different financing structures.
Practical Ways to Use This Template
Compare Multiple Investment Properties
If you’re evaluating several deals at once, this Excel template makes it easy to compare them side-by-side. Instead of switching between files, you can quickly see which property offers the best return.
Analyze Deals Before Making an Offer
Before committing to a purchase, plug in estimated numbers to determine whether a deal meets your criteria. This helps you avoid overpaying or entering a low-performing investment.
Run Scenario Analysis
What happens if rent is lower than expected? What if expenses increase? This template allows you to adjust inputs and instantly see how returns change, helping you prepare for different outcomes.
Track Portfolio Performance
You can also use this template to monitor properties you already own. Keeping everything in one place makes it easier to evaluate performance and identify areas for improvement.
Tips for More Accurate Results
- Be conservative with rent estimates to avoid overestimating returns
- Include all expenses, even irregular ones like repairs and vacancy costs
- Update numbers regularly to reflect actual performance
- Use consistent assumptions when comparing properties
Accuracy in your inputs leads to better decisions, so take the time to gather reliable data before relying on the results.
Excel First, Google Sheets Compatible
This tool is built as an Excel template, giving you full functionality and flexibility inside Microsoft Excel. If you prefer working in the cloud, it also works smoothly when uploaded to Google Sheets, so you can access and edit your data from anywhere.
Who This Template Is For
This Excel template is useful for:
- Beginner real estate investors learning how to evaluate deals
- Experienced investors comparing multiple opportunities
- Landlords tracking rental property performance
- Anyone analyzing ROI before purchasing property
Save Time and Make Smarter Investment Decisions
Real estate success depends on understanding your numbers. This Excel template removes the guesswork by giving you a clear, structured way to evaluate rental properties.
Instead of building formulas or second-guessing calculations, you can focus on identifying profitable opportunities and growing your portfolio with confidence.
Download the template, enter your numbers, and start analyzing your next investment today.