Running a SaaS business means constantly monitoring the health of your recurring revenue. Metrics like Monthly Recurring Revenue (MRR), Annual Recurring Revenue (ARR), churn rate, customer acquisition cost (CAC), and lifetime value (LTV) tell the real story behind your growth. Without a clear system to track these numbers, it becomes difficult to understand trends or make confident decisions.
This Excel template provides a simple and structured SaaS metrics dashboard designed to track your most important subscription metrics each month. Built for Microsoft Excel and fully compatible with Google Sheets, this dashboard helps founders, finance teams, and operators visualize revenue growth and customer retention in one place.
Instead of building complicated spreadsheets from scratch, you can use this ready-to-use Excel template to monitor your recurring revenue metrics and quickly identify whether your SaaS business is growing, plateauing, or losing revenue to churn.
Why SaaS Metrics Matter
Unlike traditional businesses, SaaS companies rely heavily on recurring revenue. This makes certain metrics far more important than simple sales totals. Understanding the relationship between new revenue, expansion revenue, and churn is essential for sustainable growth.
Tracking SaaS metrics helps you:
- Measure the true growth of recurring revenue
- Identify whether churn is eroding your progress
- Understand the impact of upsells and upgrades
- Evaluate customer acquisition efficiency
- Plan realistic financial forecasts
Even a growing SaaS company can struggle if churn is too high or acquisition costs are unsustainable. This Excel template helps you keep these indicators visible and organized every month.
What This Excel SaaS Metrics Dashboard Tracks
The dashboard focuses on the core metrics most SaaS companies track during monthly reporting. Each row represents a month, allowing you to observe changes over time and quickly identify trends.
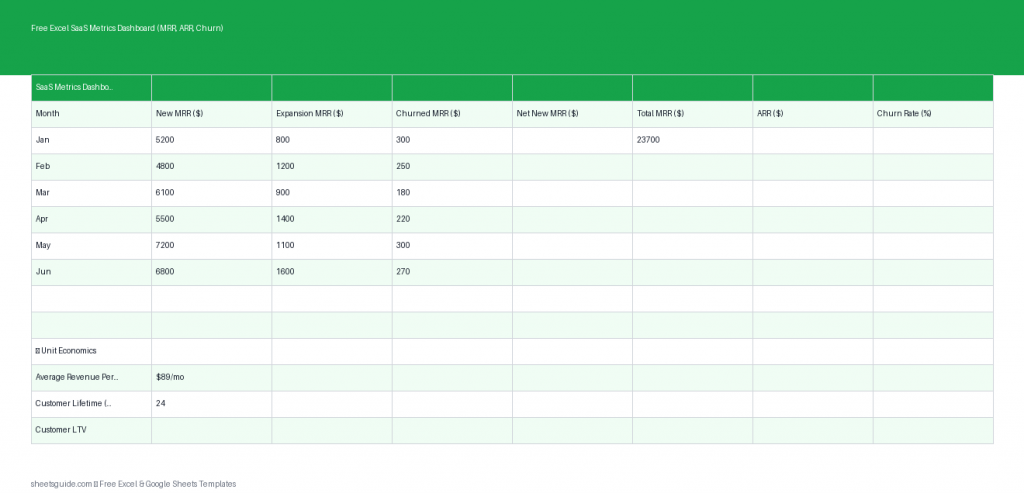
Included Columns in the Template
- Month – The reporting month for your SaaS metrics.
- New MRR – Monthly recurring revenue gained from new customers.
- Expansion MRR – Additional revenue from upgrades, add-ons, or plan expansions.
- Churned MRR – Revenue lost from canceled subscriptions.
- Net MRR – The net change in recurring revenue after gains and losses.
- Total ARR – Annual recurring revenue calculated from your MRR.
The Excel template automatically calculates key totals so you can quickly understand whether your SaaS revenue is moving in the right direction.
Key SaaS Metrics Explained
Monthly Recurring Revenue (MRR)
MRR represents the predictable revenue your SaaS business generates each month from active subscriptions. It is one of the most important metrics for evaluating business health because it shows consistent income rather than one-time payments.
Expansion MRR
Expansion revenue comes from existing customers who upgrade their plans, purchase additional seats, or add new features. Strong expansion revenue is a sign of a product that delivers growing value to customers.
Churned MRR
Churned MRR tracks revenue lost when customers cancel their subscriptions or downgrade their plans. Monitoring churn closely helps you identify product issues, pricing problems, or poor onboarding experiences.
Net MRR
Net MRR combines new revenue, expansion revenue, and churned revenue to show the overall monthly change. This metric gives you a clearer picture of growth than looking at new sales alone.
Annual Recurring Revenue (ARR)
ARR represents your yearly subscription revenue and is typically calculated by multiplying MRR by 12. Investors and leadership teams often use ARR to evaluate the scale and growth potential of a SaaS company.
Who Should Use This Excel Template
This Excel SaaS metrics dashboard is designed to be simple enough for startups but structured enough for growing companies.
It works especially well for:
- SaaS founders tracking growth and churn
- Startup teams preparing investor updates
- Finance teams monitoring recurring revenue
- Product teams evaluating retention trends
- Operators managing monthly reporting
Because the template works in both Excel and Google Sheets, teams can easily collaborate and share reports while maintaining a consistent data structure.
Benefits of Using an Excel SaaS Metrics Dashboard
Clear Monthly Visibility
By tracking metrics monthly, you can identify changes quickly. Sudden spikes in churn or drops in expansion revenue become immediately visible.
Simplified Financial Tracking
Many SaaS teams rely on complicated analytics tools. While powerful, they can be overwhelming for early-stage companies. This Excel template provides a clear and lightweight alternative.
Better Strategic Decisions
When you consistently track MRR and churn, decisions about marketing spend, pricing changes, or product development become much easier.
Investor-Ready Data
If you plan to raise funding, investors will almost always ask for SaaS metrics. Maintaining a structured Excel dashboard ensures you always have clean numbers ready.
Example Monthly SaaS Tracking Workflow
Many teams use a monthly reporting rhythm when updating SaaS metrics. A simple workflow might look like this:
- Collect subscription revenue data from your billing platform.
- Calculate new revenue generated during the month.
- Record upgrades or expansion purchases from existing customers.
- Calculate churned revenue from cancellations or downgrades.
- Enter the numbers into the Excel SaaS metrics dashboard.
- Review Net MRR and ARR trends.
Over time, this creates a powerful dataset that reveals whether your business is accelerating or losing momentum.
Tips for Getting the Most from This Dashboard
Update It Consistently
Consistency is key. Update your SaaS metrics at the same time every month to maintain reliable historical data.
Separate New vs Expansion Revenue
Distinguishing between new customers and expansion revenue helps you understand whether growth is coming from acquisition or customer success.
Watch Churn Carefully
Even small increases in churn can dramatically impact long-term growth. Monitoring churned MRR every month helps catch issues early.
Track Trends Over Time
The real value of this Excel template appears after several months of data. Patterns in growth, churn, and expansion become much easier to identify.
How to Use in Excel
- Download the Excel template file to your computer.
- Open the file in Microsoft Excel.
- Enter each reporting month in the Month column.
- Input revenue data for New MRR, Expansion MRR, and Churned MRR.
- Review the automatically calculated Net MRR.
- Check the Total ARR value to see your annual recurring revenue.
- Repeat the process each month to build a complete SaaS performance history.
The template is built primarily for Excel but is also fully compatible with Google Sheets, allowing teams to collaborate easily if they prefer a cloud-based workflow.
Build a Data-Driven SaaS Business
Great SaaS companies rely on metrics to guide their strategy. When you consistently track recurring revenue, expansion, and churn, you gain the clarity needed to grow sustainably.
This free Excel template gives you a clean, practical system for monitoring the metrics that matter most. Whether you’re running a startup, managing a growing SaaS product, or preparing investor reports, a structured SaaS metrics dashboard makes financial insights far easier to understand.
Download the Excel SaaS Metrics Dashboard and start tracking your MRR, ARR, and churn with a clear monthly view of your subscription business.