
Excel LET function: reusable variables in your formulas
Excel LET function lets you name a value once and reuse it through a formula — faster recalcs, cleaner code reviews. See the refactor patterns inside.
Excel LET function lets you name a value once and reuse it through a formula — faster recalcs, cleaner code reviews. See the refactor patterns inside.
Google Sheets dropdown chips replace plain validation lists with colored pills. Add them, color the values, convert a whole column, then read on.

Build arrays inline with curly braces in Google Sheets — stack ranges, fix locale errors, feed FILTER or QUERY. Read the patterns that save real time.
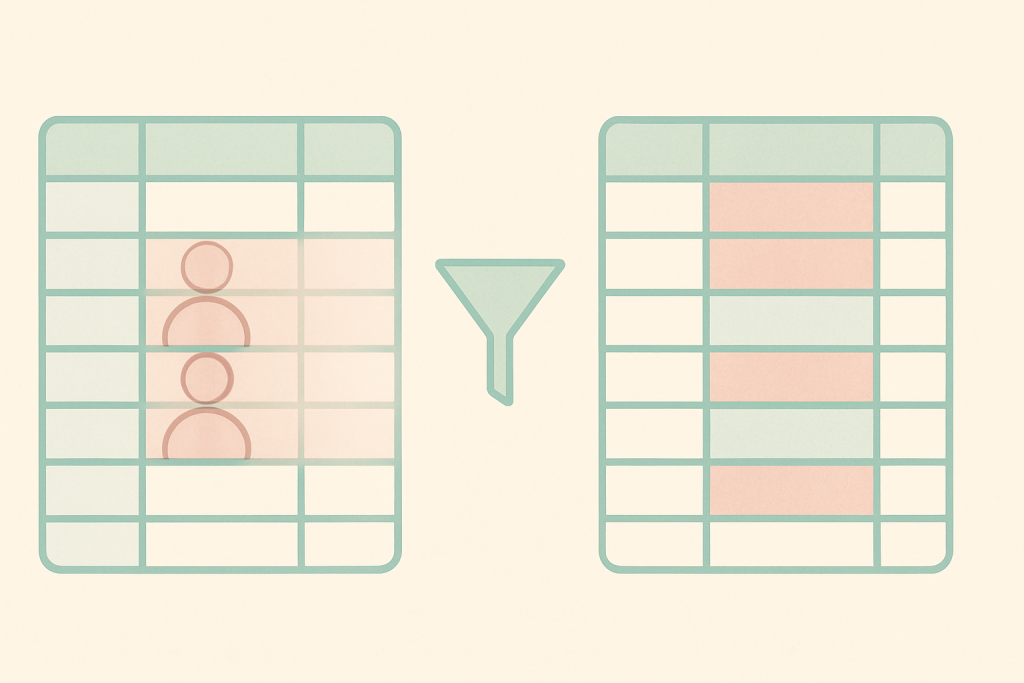
Excel remove duplicates vs UNIQUE function: which handles blanks, case, edge cases, and large data better, and when each one is the right pick. Read on.
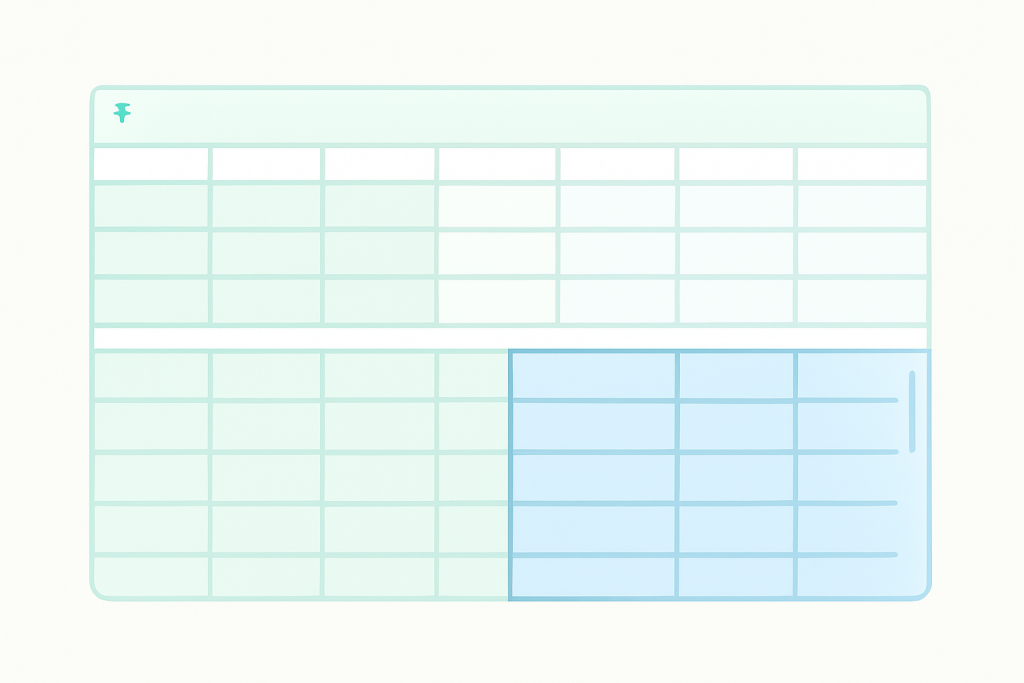
Excel freeze panes locks one fixed strip; split window opens two scrollable views. Here’s when to pick each and the gotchas guides skip. Read on.

IMPORTHTML in Google Sheets pulls a table or list straight from a URL. See the syntax, the index trick, QUERY slicing, and why some pages just won’t load.

An Excel waterfall chart turns a P&L into a visual cumulative trail. Get the data layout, the Set as total clicks, and the floating-bar fix below.
Google Sheets named functions wrap long formulas behind one call. Build, debug, import, and know when a helper column wins instead. Read on.

Excel Flash Fill extracts patterns from text without a single formula. See how to feed it examples, fix silent misses, and when a formula is faster.

REGEXREPLACE in Google Sheets fixes messy text in bulk — strip junk, reformat dates, standardize phones. Patterns, ARRAYFORMULA, RE2 gotchas inside.

Use GOOGLEFINANCE in Google Sheets to pull live stock prices, currency rates, and historical data, with the attributes and fixes that matter. Read on.

Power Pivot DAX measures confuse most beginners. Write your first explicit measure, fix wrong grand totals, and learn SUM vs SUMX. Start here.