
10 Essential Excel Formulas Every Professional Should Know
The dozen Excel formulas that cover 90% of real work — SUM, IF, SUMIF, VLOOKUP and XLOOKUP, text and date functions, plus absolute references and IFERROR.
The dozen Excel formulas that cover 90% of real work — SUM, IF, SUMIF, VLOOKUP and XLOOKUP, text and date functions, plus absolute references and IFERROR.
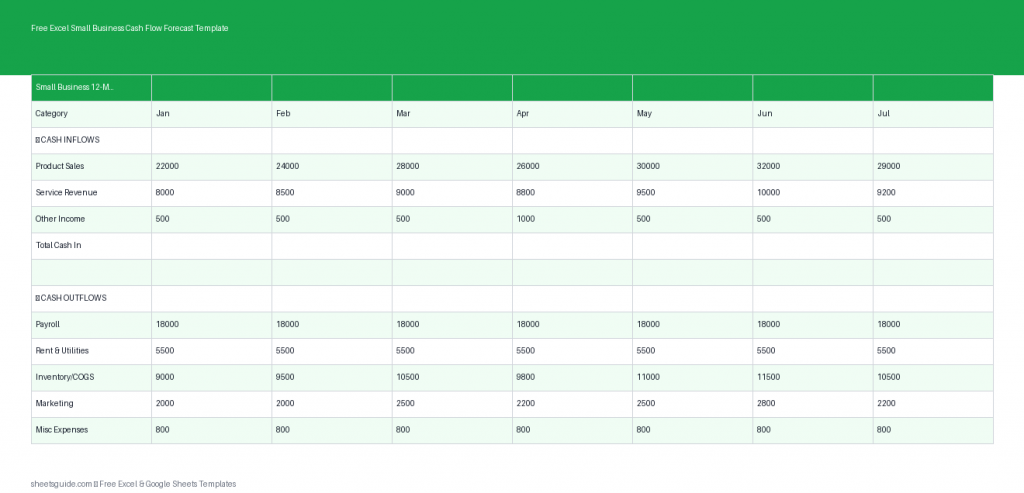
Plan your finances with this free Excel template for 12-month small business cash flow forecasting.

Build a budget in Google Sheets that maintains itself — a transaction log plus a SUMIF summary, budget-vs-actual, overspend coloring, and month-over-month tracking.
Track YouTube income and growth with this free Excel template for revenue, views, RPM, and monthly totals.
Build a sales tracker in Google Sheets without a CRM: a deal log, weighted-forecast and win-rate formulas, a live dashboard, and flags for stale deals.
Download this Excel template to manage employee records across multiple sheets with summaries and department reports.

Use VLOOKUP effectively in Excel — the four arguments, why you always end with FALSE, locking the table, cross-sheet lookups, IFERROR, and when to switch to XLOOKUP.
Track campaigns, budgets, and ROI with this free Excel template that also works in Google Sheets.

Build a task tracker in Excel that runs your week — the right columns, dropdowns, priority and overdue coloring, progress bars, checkboxes, filtering, and a pivot summary.
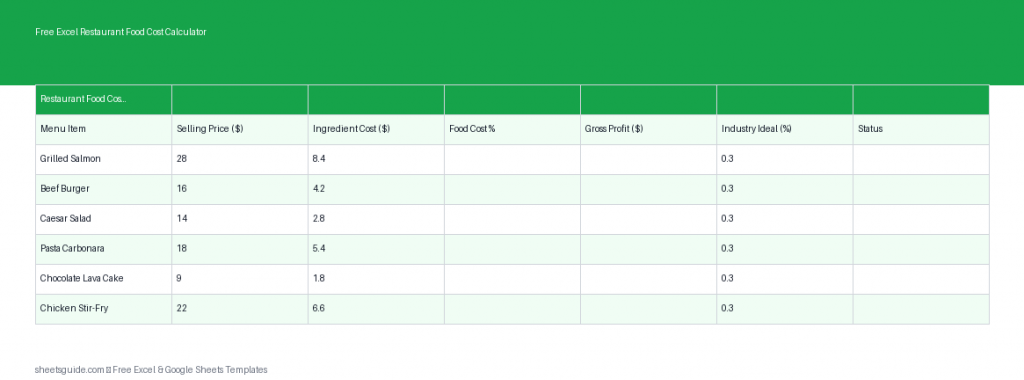
Free Excel template to calculate restaurant food cost %, pricing, and profit margins with ease.

Excel’s key financial functions explained — PV, FV, PMT, NPV, IRR, RATE, IPMT — plus the sign convention and rate-period rules that break most first formulas.
Download this free Excel template to track e-commerce profit, ROAS, ad spend, and product margins by SKU.