“`html
Free Excel Annual Financial Dashboard Template
Introduction
In today’s fast-paced business environment, having access to real-time financial data is crucial for making informed decisions. We are excited to introduce our upgraded Excel Annual Financial Dashboard Template, now with a fully integrated three-sheet model that includes Income, Expenses, and Dashboard sheets, all auto-linked. For those seeking efficiency and accuracy in their financial tracking, this template is a game-changer. Whether you’re a small business owner, a finance manager, or an individual looking to keep tabs on your finances, this tool is designed to help you streamline your financial management.
What’s Included
This versatile tool includes the following:
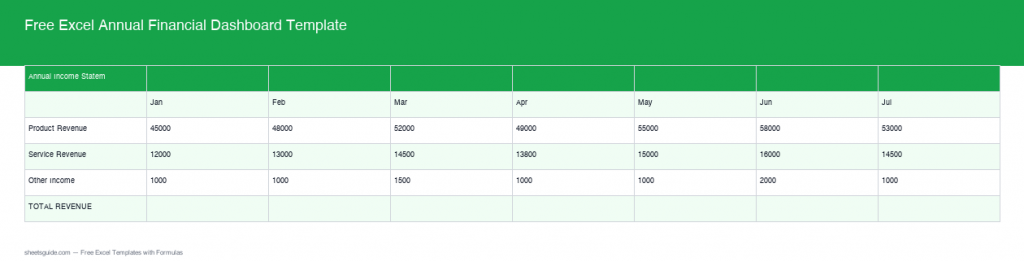
- Income Sheet: Document and calculate all income streams in one easily navigable space. You can categorize the income by type, such as sales, service revenue, or other sources, to gain insights into what drives your revenue. Automatic updates feed to the dashboard, ensuring your revenue data remains up-to-date.
- Expenses Sheet: Keep track of all organizational expenses, sorted automatically by category and timeframe, with real-time updates flowing through to the dashboard. This sheet allows you to segregate fixed and variable costs for more precise financial analysis.
- Dashboard Sheet: A comprehensive overview of your financial situation, depicted through totals for revenue, expenses, gross profit, and net margin. Visual indicators and graphs provide a quick view of your financial health, allowing for swift assessments and adjustments as necessary. This sheet auto-calculates these totals using data from the other sheets, providing you with a seamless financial snapshot at any moment.
Key Features & Formulas
The template is power-packed with unique features and formulas:
- Built-in Formulas: The Income and Expenses sheets come equipped with SUMIFS and VLOOKUP functions to dynamically categorize and summarize data based on your inputs. For example, you can use SUMIFS to calculate total sales from specific products or services within defined time frames, helping you make tailored decisions.
- Real-Time Calculations: The Dashboard harnesses data linkage to automatically calculate:
- Total Revenue: Derived from the Income sheet using the SUM function, providing you with immediate insight into your earnings.
- Total Expenses: Calculated from the Expenses sheet, keeping you informed about cash outflows and highlighting areas where you can cut back if necessary.
- Gross Profit: Automatically computed as Total Revenue minus Total Expenses, giving you an immediate understanding of profitability before other costs.
- Net Margin: This crucial profitability metric is calculated as (Gross Profit / Total Revenue) * 100, giving a percentage view of financial health and allowing for comparisons with industry standards.
- User-Friendly Interface: Designed with aesthetic charts and graphs to visually represent financial data and trends. You can customize these visuals to reflect your unique business metrics or personal financial goals, making it not only functional but also personalized.
How to Use in Excel
- Download the Template: Download Free Excel Template
- Input Your Data: Start by entering your financial data in the Income and Expenses sheets. Be meticulous with this step; accurate data entry is vital for reliable outputs in the dashboard.
- Navigate to the Dashboard: Observe how the Dashboard sheet auto-updates, showcasing your financial overview with clarity. Make sure to verify that all data is reflecting correctly.
- Customize Charts: Feel free to adjust the charts and graphs to match your specific requirements or branding. Excel also offers various chart types; don’t hesitate to explore options that highlight your unique data story.
Tips
- Regular Updates: Consistently update your Income and Expenses sheets to keep your financial overview current and actionable. Set a regular cadence for data entry, whether it’s weekly, monthly, or quarterly, depending on the volume of transactions.
- Analyze Trends: Use the visualization tools in your Dashboard to identify trends over time. For example, if you notice a dip in revenue for a particular month, it may warrant further investigation to understand the causes.
- Share with Stakeholders: If you’re using the dashboard for a business, consider sharing it with your team or stakeholders for collaborative financial planning. Excel allows you to protect certain cells while sharing, ensuring sensitive data remains confidential.
- Leverage Conditional Formatting: Utilize Excel’s conditional formatting to highlight key metrics, such as when expenses exceed revenue or when net margin falls below your target threshold.
- Integration Options: Explore compatibility with other tools you might be using, such as accounting software or other financial applications. This can enhance data accuracy and eliminate redundancy in your financial management processes.
Conclusion
The Excel Annual Financial Dashboard Template is a powerful asset for anyone looking to maintain a proactive approach to financial management. The seamless integration between the Income, Expenses, and Dashboard sheets ensures you have all the data you need to make informed decisions. Start taking control of your financial future today by downloading the template and unlocking its full potential. Whether you’re tracking your personal finances or managing business accounts, this user-friendly tool will be a cornerstone of your planning strategy.
“`