“`html
Free Excel KPI Dashboard Template
Introduction
Tracking your Key Performance Indicators (KPIs) is essential for business growth and success. That’s why we’re excited to introduce our enhanced Free Excel KPI Dashboard Template, now with built-in real formulas and advanced features to make your data tracking smoother than ever! This updated version not only helps you streamline your data but also ensures precision through its advanced Excel capabilities.
KPIs are critical in understanding how well your business is performing relative to your goals. With our KPI Dashboard Template, you can quickly visualize and analyze this data, leading to informed decision-making.
What’s Included
Our Free Excel KPI Dashboard Template now comes with a robust 2-sheet model:
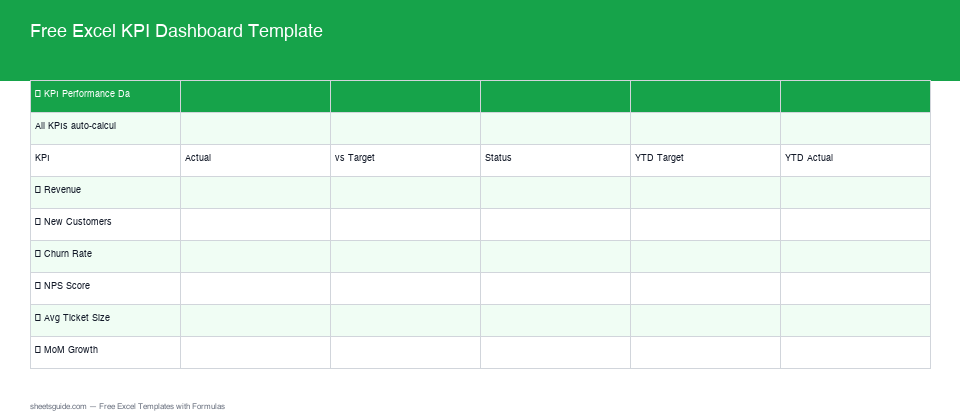
- Dashboard: This sheet provides a visual overview of your KPIs, making it easy to comprehend data at a glance. It includes charts, graphs, and indicators that give instant feedback on your business performance.
- Raw Data: The backbone of the template where your data is inputted and stored, allowing for seamless integration with the dashboard. This sheet is designed for versatility, accommodating various data types and formats.
With these sheets working in harmony, the Dashboard automatically pulls data from the Raw Data sheet, ensuring real-time updates and accuracy. You can also customize your dashboard by selecting different visualization options, allowing for tailored insights relevant to your stakeholders.
Key Features & Formulas
Here are some of the advanced features and key formulas that make our Excel template indispensable:
- On Target/Behind Status: Built-in formulas evaluate and display whether your KPIs are on target or behind expectations, allowing for quick performance assessment. For example, if your target sales are $10,000 and your current sales are $8,000, the dashboard will instantly highlight that you are $2,000 behind.
- Year-to-Date (YTD) Tracking: Automated YTD calculations provide a running total of your performance metrics, crucial for understanding annual progress. This feature allows you to see how your actual results compare against your full-year objectives in real-time.
- Monthly Trend Data: This feature captures and displays month-to-month changes, empowering better trend analysis and decision-making. For instance, by visualizing your sales over the past twelve months, you can identify patterns and seasonal variations.
- Customizable Alerts: You can set thresholds that trigger visual alerts on your dashboard when KPIs deviate from expected norms, such as a drop in customer satisfaction scores which would be highlighted in red.
How to Use in Excel
Getting started with our template is straightforward:
- Download the Template: Download Free Excel Template
- Input Your Data: Navigate to the Raw Data sheet and enter your KPI data. Ensure you follow the format specified within the template for the results to integrate correctly into the dashboard.
- Analyze: Go to the Dashboard sheet to see your data visually represented and automatically analyzed through our formula-driven charts and indicators. Take time to familiarize yourself with the layout to unlock the full potential of the insights provided.
Tips for Maximizing the Template
- Regular Updates: Frequently update the Raw Data sheet to ensure the Dashboard reflects the most current insights. Establish a schedule for data updates, such as weekly or monthly, to maintain the relevance of your KPIs.
- Customize: Tailor the template to better fit your specific KPIs and performance metrics should you have unique business needs. Adjust the target values or add new KPIs to align the dashboard with changing business objectives.
- Validate Data: Double-check your raw data entry for accuracy to make the most of the auto-calculate features. Implement a verification checklist before entering significant data changes to minimize errors.
- Integrate with Other Tools: Consider linking your KPI dashboard with other data sources or software such as your CRM tools or marketing analytics for a more comprehensive view of performance.
How to Use This Template in Google Sheets
This template is provided as an .xlsx file compatible with both Microsoft Excel and Google Sheets. To use it in Google Sheets, simply upload the downloaded Excel file to your Google Drive and open it with Google Sheets. Note that certain advanced Excel features may not work identically due to the differences between the two platforms. However, for the majority of users, Google Sheets will retain the functionality needed to manage and analyze your KPIs effectively.
Once the template is open in Google Sheets, you can enjoy the same dashboards and analysis tools. Additionally, you can collaborate in real-time with team members, facilitating better communication and strategy development as data insights are shared instantly.
Conclusion
Our Free Excel KPI Dashboard Template is a powerful tool that can significantly enhance your business’s ability to track and evaluate performance effectively. By leveraging this template, you can make data-driven decisions with confidence. Download our template today and take the first step toward streamlined reporting and improved performance analysis!
“`