
Free Excel Sales Commission Calculator with Tiered Rates
Free Excel template to calculate tiered sales commissions automatically with built-in formulas.
Free Excel template to calculate tiered sales commissions automatically with built-in formulas.

Conditional formatting in Excel — built-in rules, data bars, color scales and icon sets, custom-formula rules, whole-row highlights, and managing rule order without the rainbow.
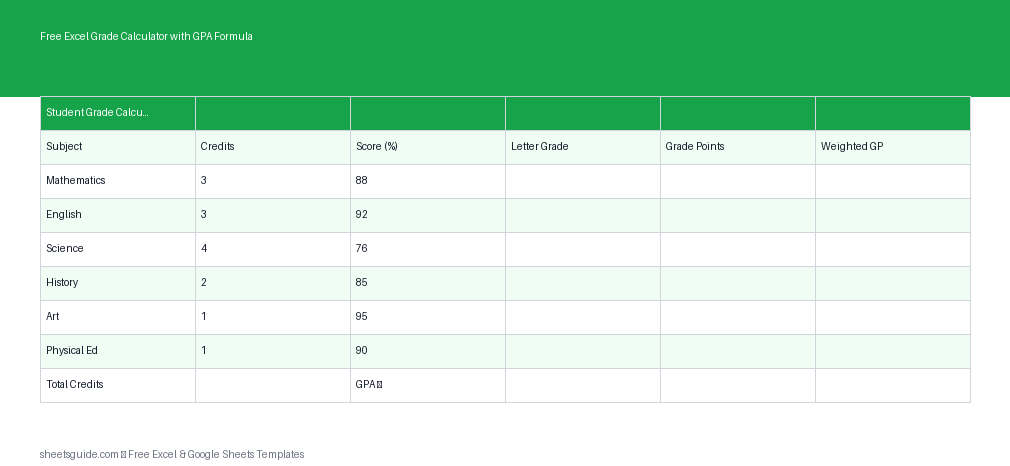
Download this free Excel template to calculate grades, weighted averages, and GPA automatically with built-in formulas.
A Google Sheets budget-tracking template you’ll actually keep up — own your categories, make entry fast, automate recurring expenses, track goals visually, and review monthly.
Download a free Excel template to track job applicants, interviews, and hiring progress in one organized place.

Make a Google Sheets dashboard interactive — slicers, a dropdown-driven QUERY that changes the charts, a date-range selector, a dynamic title, and checkbox toggles.
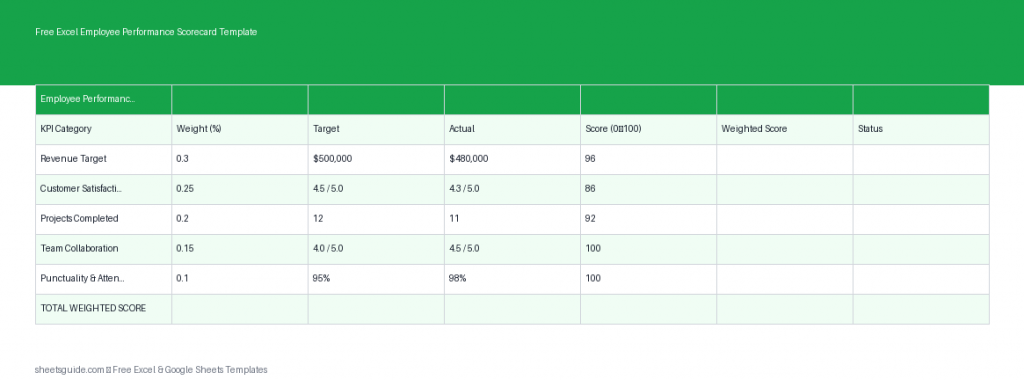
Track KPIs and evaluate staff with this free Excel template featuring weighted scores and automatic ratings.

How to use Google Sheets add-ons well — installing from the Marketplace, the categories worth knowing, when a built-in like QUERY beats an add-on, and how to vet before granting access.
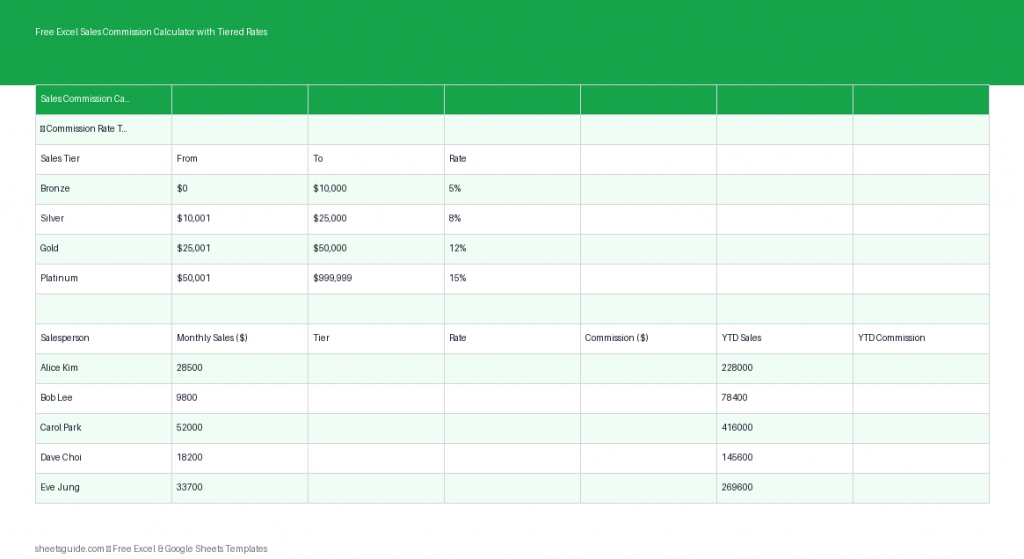
Download this Excel template to calculate tiered sales commissions automatically with built-in formulas.

A reliable Excel data-analysis workflow — frame the question, clean and structure the data, explore with a pivot, pick the right tool, and verify before you trust the result.

Download a free Excel template to calculate grades, weighted averages, and GPA automatically with built-in formulas.

Analyze large datasets in Google Sheets — filter views, QUERY, FILTER, pivot tables, IMPORTRANGE, and performance habits like closed ranges that keep it fast past 100k rows.